Showing posts with label Yahoo Finance. Show all posts

Tuesday, March 24, 2009

End of Rally?

I don't know. You don't know. I wish I knew. All I can say is- I've prepared for a correction/retracement/dive, etc. Yesterday, at market close (which was perfect timing but only because I had no choice), I sold all of the mutual funds in my 401k and transferred the money into a safer, bond fund. I plan to buy back the exact mix of funds if the DOW dips below 6,500 in the next month. If that doesn't happen- I'm wrong, but 'missed money is still better than lost money'. Also, if we don't correct soon, you can throw RSI's usefullness out the window (cuz we've just entered 'overbought' territory):


As for the Think or Swim account tied to my Covestor ID, I'm also preparing for the end of (imo) the bear market rally. I averaged up my PALM short today, adding 100 shares at 8.81. I'm also long 25 shares of my friend FAZ (avg. about 25.75ish). Forgive me for not updating the avg. prices on the right hand side lately. Knowing that Covestor verifies every trade has made me a bit lazy- I'll try to do better.

In case you're worried that I've stopped posting/trading/reading the Yahoo! Finance boards, etc.- Have no fear! I've been keeping up with all of that and then some. I've decided to build a webpage that focuses on why I trade. Yeah, the 'Mission Trip' part. Mission-trading.com is my new project (like I need one- and be kind, it's not completely finished). The blog you're reading is pretty much 99% about the 'trading' part (and will continue to be so), but fails to expound on the reason I trade. I'm not saying mission-trading.com will be 99% about missions, but it will certainly bring to light the connection between the two passions that drive me.

Hoping the country and my shorts somehow thrive,

Evan

Friday, February 13, 2009

Mission Accomplished: GERN

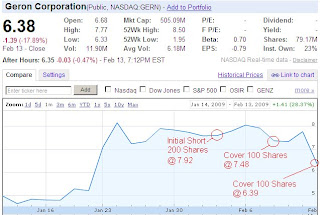
It's a shame my Covestor widget (right hand side of page) hasn't updated yet. I'm at all-time highs (yeah, what is this- my first week active?)! We'll start with GERN, the stem cell stock I admitted to being a bit leary of after reading Yahoo! Finance message boards. Seriously, pick any stock I'm short, pull it up on Yahoo! Finance, and enjoy the ridiculous pumping and bashing that goes on 24/7! I'll always try to post a chart of my completed shorts, though the longer it takes to cover, the less detail online charts will show.

In other news, I bit the bullet and sold 3,000 of my 5,000 shares of SIRI. If it goes to the moon (like you'll see repeatedly in Yahoo! posts) I'll do alright, but if it goes belly up (probably 7 out of 10 posts on Yahoo!), I'll survive. I'm banking on these shorts for the time being, and my strategy was quite profitable again today. Enjoy the weekend and check out my Covestor account Sunday-ish (it should be updated by then and you'll be able to see my trade prices if you're a member- which is FREE!)

O.K. with two 'Not-So-Volatile' Days (hopefully),

Evan

Friday, January 30, 2009

Watching Paint Dry

In case you're wondering, I'm still short 300 Shares of MAXY (and still have my GTC order to cover 200 shares at 7.90). It is down trending nicely (even if it's slooooow). There are a couple 'bearish' technical indicators that look promising at this point. I wouldn't even know where to begin to try and explain technical analysis on this blog (and don't have the time or the energy), so I'll just use links to the terms I'm referring to and charts to better illustrate my theories ('theories' meaning that I welcome other opinions). Below is a chart taken from Yahoo! Finance and given the once-over in Microsoft Paint. I've only added black lines to show the first bearish indicator of 'down trending' (when a stock makes lower highs and lower lows). The second indicator is MACD. You'll notice, if you click here and read the Wikipedia definition, that when the MACD goes below zero, it is a bearish signal. This seems to be about to happen to MAXY even though the price has held it's ground.


GERN is my next target, thanks to TIM for bringing this stock to my attention. Stem cell stocks are 'in play' right now (meaning this sector is pretty much en fuego, being both volatile in price action and volume). It reminds my of the late '90s tech boom, when every company (penny stock or not) associated with the Internet was blowing up (as detailed in Timothy Syke's book- An American Hedge Fund). Thanks to the new Obama Nation (abomination?), stem cell research has been given the green light. I would love to see a true 'Supernova' (see last year's stocks PDO and MXC for supernova-type price action) come out of this new 'gold rush'.


Happy prospecting,

Evan

Thursday, January 15, 2009

Picture Perfect

What a great day for this Sykes/Swing trading strategy! As mentioned in my previous post, I'm eagerly anticipating MAXY to break it's $8 support level. Today marked it's third attempt and, despite my previous 'Third time's a charm' wishful thinking, third failure to crack $8. When it couldn't break support after multiple attempts (as evident by today's chart below- courtesy of Yahoo! Finance), I decided to cover 100 shares.


To help you understand why I only covered 100 shares instead of the full 300 (already profitable) shares, here's a fairly detailed time line of thinking and text messaging to my broker (aka. future brother-in-law Eric who happened to be home with Think or Swim's software open:)

Text to Eric (10:01am): Maxy?
Text to Evan (10:15am): Down to 8.10
Text to Evan (10:23am): Low 8.04 back to 8.10
Text to Eric (10:38): Cover 100 under 8.05 if it gets back
Text to Evan (10:45am): Covered 100 at 8.05

I knew that MAXY was flirting with $8, and hoped it would break it- but when it didn't, I opted to play it safe (fearing another spike after another failed attempt). I figured (and this happened to be correct) that I could cover a portion of my shares, lock in some profits, and re-short the same 100 shares at a higher price if it bounced off support (like it did). My re-short of 8.47 basically happened because it was late in the day and I had the option to average up my short position. Below is the screenshot of my Think or Swim account's trading history over the past week to confirm. Could tomorrow be the fateful 'dip into the $7 range' day for MAXY? Stay tuned...


Happy Friday Trading!

Evan

Monday, January 12, 2009

Mission Accomplished: HSNI

I've completely closed my HSNI short by covering the last 50 shares at $4.84. Below is a screenshot from Think or Swim showing the exact time of my fill, as well as the total P/L (profit/loss) for HSNI and running P/L for my short-in-progress MAXY.


I have to say, this stock couldn't have reacted more perfectly. Here is the progression from rise to fall (feel free to click here to follow along with the 3 month, Yahoo! chart):


1. Stock had dropped to $1.50ish in early Dec. (just a bit over a month ago)
2. After breaking out of numerous resistance ceiling's (mostly around the $4 range), volume spikes (and no doubt some short-covering) helped to push this over $6 (enter my initial short), then $7.
3. Volume began to fade along with the stock price.


This one really was that simple. I documented my thoughts all along the way with this blog, even saying that I would cover in the upper $4s. I was surprised it happened as quickly as it did, but said all along it was inevitable. After commissions ($45) my total profit for HSNI was $403.52. Not bad for two weeks and what I'd call a no-brainer play. Below is an example of a 5-day chart any short loves to see.


Thus concludes my celebrating. I'm out to find the next short (Thanks to TIM for finding HSNI) while waiting for MAXY to fall. I'd love to hear any thoughts, critiques, and/or questions on this trade.


Thrilled at my strategy's first big confirmation,


Evan

Saturday, December 27, 2008

Trading Week Ending 12/26/08

As mentioned in my previous/first post, my capital for trading has diminished greatly due to other investments and travel/missions. I am, however, trading extremely cautiously with an account I jointly oversee at Think or Swim. My future brother-in-law (also an experienced missionary) and I are using this account to both learn necessary skills needed to consistently trade profitably (a feat in which over 90% are said to have never achieved) and slowly add to it's bottom line.


Below, I've added charts and screenshots of the aforementioned Think or Swim account in order to illustrate this past week's trades (Sensitive account information has been intentionally left out). If you're unfamiliar with Think or Swim, I highly recommend checking out their website (I've always gotten great customer service from them, as well as reserves for hard to borrow stocks). This first screenshot details trade history (parameters set for 7 days). You'll notice the dates and times of the trades to the left, as well as the executed trade price on the right.


Below is a screenshot of a 5 minute chart for HSNI (a stock I was alerted to by both Timothy Sykes and Muddy over at Green on the Screen and Darkside Trading). My rationale for the initial short: HSNI had multiple up days in a row, and imo will inevitably fall back down to 'normal' price levels. The morning spike to 6.62ish had been the highest of the current run, so I was shorting with the prediction that, given the fading mid-day volume, HSNI would be unable to breakout passed that price. Did I short early and without confirmation? The simple answer is yes. I did have a mental stop-loss in place should my theory be proved wrong and the stock climb to make a new high. My prediction proved to be correct, and I decided to hold overnight as the stock failed to rise above my entry price late in the day (which would mark the 2nd retest of the day's/current run's high). HSNI had a nice drop most of the short trading day (which I would have covered into had I had more than 200 shares in play). I decided when the stock began to rally before close. Friday's volume was fairly unimpressive, and Tuesday's triple top gave a pretty firm ceiling for the stock to break through, so I decided to re-short after the morning spike had started to wane. I held over the weekend, wanting to see an identical drop as in the Tues.- Wed. price action. With the fading volume and failure of HSNI to make new highs after several attempts, this stock 'should' react accordingly. Knowing that stocks can pretty much do whatever they want, my mental stop-loss is in place. I'm already in the money at this point with HSNI, so barring a huge gap-up, I should be able to cover tomorrow. Again, I probably would have covered when the morning spike fell close to 6.20 if I was trading more shares.

This chart from Yahoo finance details the same time frame for HSNI as the one above, but shows the volume, clearly defined dates (both are also on the TOS chart but it would have made the image unnecessarily large) and is accessible by anyone with an internet connection. It would, however, be virtually impossible to trade using Yahoo charts because of the 10 minute or so time delay.

Below is the actual profit/loss information from the modest Think or Swim account. I've listed the top ten gainers of the last year to demonstrate the validity of shorting penny stocks that have run too far, too fast (a strategy I first learned from Timothy Sykes). It's no coincidence that 7 out of the top ten fit this description (the other three- MMM, FRE, and BBY aren't penny stocks and I probably shouldn't have been trading them in the first place). The bottom of my P/L list is made up of similar 'Big Board' stocks, and to my detriment carry larger losses than the top ten gainers- valuable lessons are all they gave me.